CPT Analyst
REFERENCES
Earth Technology Corporation, (1991) The Cone Penetration Test (CPT): A Guide to Application, Methodology, and Data Interpretation, Testing Services Group, Huntington Beach, CA
Ladd, C., R. Foot, K. Ishihara, F. Schlosser, and H.G. Poulos(1977), “Stress-Deformation and Strength Characteristics,” proceedings of the 9th International Conference on Soil Mechanics and Foundation Engineering, Tokyo, Vol. 2, pp. 421-494.
Meigh, A.C. (1987), Cone Penetration Testing: Methods and Interpretation, Ground Engineering Report: In-Situ Testing, Construction Industry Research and Information Assoc. (CIRIA), Butterworths, London.
Pradel, Daniel, (1998) “Procedure to Evaluate Earthquake-Induced Settlements in Dry Sandy Soils” Journal of Geotechnical Engineering Division, ASCE, 98(4), 364-368
Robertson, P. K. (1990) “Soil classification using CPT.” Canadian Geotechnical Journal, Ottawa, 27(1), 151-158
Robertson, P. K. and Wride, C. E. (1998) “Evaluating cyclic liquefaction potential using the cone penetration test.” Canadian Geotechnical Journal, Ottawa, 35(3), 442-459.
Robertson, P. K., and Fear, C. E. (1995) “Liquefaction of sands and its evaluation.” Proceedings, First International Conference on Earthquake Geotechnical Engineering,
Robertson, P.K. and R.G. Campanella (1984), Guidelines for Use and Interpretation of the Electronic Cone Penetration Test, Second Edition, Hogentogler & Company, Inc., Columbia, MD
Schmertmann, J.H. (1978) Guidelines for Cone Penetration Testing: Performance and Design, U.S. Department of Transportation, Federal Highway Administration, Offices of Research and Development, Washington, Report Number FHWA-TS-78-209
Seed, H. B. and Idriss, I. M. (1971) “Simplified procedure for evaluating soil liquefaction potential.” Journal of Geotechnical Engineering Division, ASCE, 97(9), 1249-1273
Seed, H. B., Tokimatsu, K., Harder, L. F., and Chung, R. M. (1985) “The influence of SPT procedures in soil liquefaction resistance evaluations.” Journal of Geotechnical Engineering, ASCE, 111(12), 1425-1445
Shibata, T and W. Teparaksa (1988), “Evaluation of Liquefaction Potentials of Soils Using Cone Penetration Tests”, Soils and Foundations, Japanese Society of Soil Mechanics and Foundation Engineering, Vol. 28, No. 2, pp 49-60, June 1988, Tokyo
Tokimatsu, E., and Seed, H. B. (1987) “Evaluation of Settlements in sands due to earthquake shaking.” Journal of Geotechnical engineering, ASCE, 113(8), 861-878
Youd, T. L., and Idriss, I. M., Editors. (1997) Proceedings, NCEER Workshop on Evaluation of Liquefaction Resistance of Soils, Technical Report NCEER-97-0022, National Center for Earthquake Engineering, Research, State University of New York at Buffalo, Buffalo, NY
Zhang, G., Robertson, P. K., and Brachman, R. W. I. (2002) “Estimating liquefaction-induced ground settlements from CPT for level ground” Canadian Geotechnical Journal, Ottawa, 39: 1168-1180
Zhang, G. Robertson, P.K. and Brachman, R. W. I. (2004) “Estimating Liquefaction-Induced Lateral Displacements Using the Standard Penetration Test or Cone Penetration Test” Journal of Geotechnical and Geoenvironmental Engineering, ASCE, August, 2004, 861-871

Figure 4-7 Report and Data File Creation options from the Layer Selection Screen
For all parameters, the user should check the references to understand the limitations of the parameter so that it is not used incorrectly.
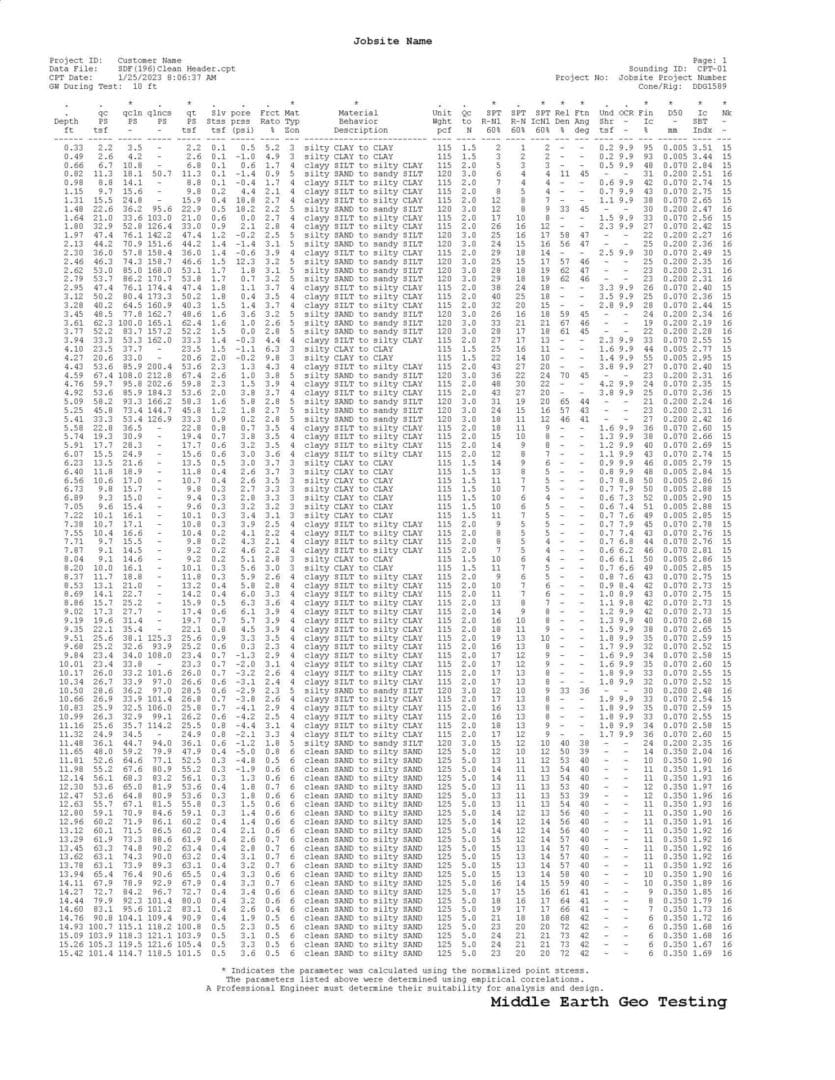
| No. | Parameter Description |
| 1 | Layer Number. Prints the layer number for the selected layers. |
| 2 | Depth to Top of Layer. Prints the top depth for the layers. |
| 3 | Depth to Middle of Layer. Prints the depth to the middle of each layer. |
| 4 | Depth to Bottom of Layer. Prints the bottom depth for the layers. |
| 5 | Thickness. Prints the thickness of the layers. |
| 6 | Measured Point Stress (qc) |
| 7 | Normalized and dimensionless Point Stress for classification. Prints the average normalized point stress for the layers. (Qn) |
| 8 | Normalized and dimensionless point stress (qc1n) |
| 9 | Normalized and dimensionless clean sand equivalent point stress (qc1ncs) |
| 10 | Sleeve Stress. Prints the average sleeve stress for the layers. |
| 11 | User defined parameter contained in the data file. Usually this would be the pore pressure. Prints the average user defined parameter or pore pressure for the layers if this data was collected. |
| 12 | Friction Ratio. Prints the average friction ratio for the layers. |
| 13 | Material Behavior Number. Prints the material behavior zone number for the layer. |
| 14 | Soil Description. Prints the soil description for the layers. The CONE program will always use the normalized point stress to determine the soil description. |
| 15 | USCS Description. Prints the Unified Soil Classification System (USCS) for the layers. The CONE program will always use the normalized point stress to determine the classification. |
| 16 | Unit Weight. Prints the unit weight for the layer. The unit weights for each material type are included in the Material Behavior Data file. |
| 17 | Number of data points in the layer that were used to calculate the average values. |
| 18 | Qc to N Ratio. Prints the corresponding Qc to N ratio each layer. This method of blow count determination is described by Robertson and Campanella and can only be used for their classification scheme. |
| 19 | Blow Count from Qc to N Ratio. Prints the blow count for each layer that was determined using the Qc to N ratio from the material behavior zone determined for each layer in the sounding
N=qc1n/(qc1n to N Ratio) An “Rat” (Ratio) in the column title indicates that the Qc to N ratio was used for the correlation instead of from a chart as indicated below. |
| 20 | Reserved |
| 21 | Relative Density is calculated using the following equation (Zhang, Robertson and Brachman, 2004)
Dr=-85*76(Log(qc1N)) |
| 22 | Friction Angle. Prints the friction angle of the layer using the following equation. (Robertson, 1998)
Tan(φ’)= (1/2.68) * (log(qc/σ’vo) ) + 0.29) |
| 23 | Undrained Shear Strength. Prints the undrained shear strength of the layer. This is not printed if the material is identified as a granular material. This value is determined from equation 5.5 in the work done by Robertson and Campanella (1984). The Nk factor is needed for this determination. This equation is shown below.
where: Su = Undrained shear strength qc1n = Corrected point stress σo = Total overburden stress Nk = Cone shape factor |
| 24 | Over Consolidation Ratio. Prints the Over Consolidation Ratio (OCR) for the layer. By knowing the undrained shear strength that was calculated above, the overburden stress and the ratio of the normally consolidated undrained shear strength to the overburden stress, the over consolidation ratio can be calculated. The form of the equation is shown below:where:
Su= Undrained shear strength σv = Effective overburden stress Su/σvNC= Ratio for normally consolidated clays The ratio of the normally consolidated undrained shear strength to the overburden stress ranges from 0.16 to 0.40 with 0.33 being the most applicable for post-Pleistocene clays. See Schmertman (1978) for a more detailed discussion. |
| 25 | Fines content from Ic (Robertson & Wride, 1998, pg 450)FC%=5 if Ic<1.26
FC%=1.75*Ic3.25-3.7 FC%=95 if Ic>3.5 |
| 26 | Reserved |
| 27 | D50. The D50 value as input by the user is printed for the layers. The units for this are in millimeters. Because this parameter is determined using the material behavior number, it already takes into account the normalized point stress effects so it will not make any difference if the AN@ is or isn’t included. |
| 28 | Nk. This is the cone factor that is used to determine the undrained shear strength. |
| 29 | Sigma= (σ’) at top of Layer. This will print the effective overburden stress at the top of a soil layer. |
| 30 | Sigma= (σ’) at middle of Layer. This will print the effective overburden stress at the middle of the soil layer. |
| 31 | Sigma= (σ’) at the bottom of Layer. This will print the effective overburden stress at the bottom of the soil layer. |
| 32 | Sigma Total (σo) at top of Layer. This will print the total overburden stress at the top of a soil layer. |
| 33 | Sigma Total (σo) at middle of Layer. This will print the total overburden stress at the middle of the soil layer. |
| 34 | Sigma Total (σo) at the bottom of Layer. This will print the total overburden stress at the bottom of the soil layer. |
| 35 | Ic material index (Youd et al. 2001, pg. 822, eq 14) |
| 36 | Cyclic Stress Ratio (CSR) (Youd et al. 2001, pg. 818, eq. 1) |
| 37 | Cyclic Resistance Ratio (CRR) (Youd et al. 2001, pg. 822, eq. 11a & 11b) |
| 38 | Kσ correction factor (Youd et al. 2001, pg. 829, fig 15) |
| 39 | Minimum Liquefaction Factor of Safety in the Layer. This takes all the Factors of Safety for each of the individual points and then determines which one is the lowest. (Youd et al., 2001, pg. 828, eq. 30) |
| 40 | Liquefaction Factor of Safety calculated using the average values from the layer (Youd et al., 2001, pg. 828, eq. 30). If the program prints an “*” then it is a soil that is not liquefiable. If it prints “N/A” then is is a soil that is liquefiable but it is above the water table so it will not liquefy. |
| 41 | Stress Reduction Factor (Youd et al., 2001, pg. 819, eq 3) |
| 42 | Volumetric Strain (ε) %. Zhang et al., 2002, pg. 1171, fig 3 and pg. 1180 below the water table, Pradel (1998) above the water table. |
| 43 | Settlement for the layer. (volumetric strain * height of layer). When this parameter is selected, the value that is printed in the table is calculated from the average parameters for the layer. The settlement value shown on the plots is calculated using the values for each individual data point and then summed over the sounding. The closer the layers resemble the data, the closer these values will be. If the layers differ significantly from the data points, then layer settlement value and the continuous settlement value can be significantly different. |
| 44 | Dry sand settlement (above the ground water) Pradel (1998) |
| 45 | Wet sand settlement from liquefaction (Zhang et al., 2002) |
| 46 | Maximum Cyclic Shear Strain (Zhang, Robertson and Brachman, 2004) |
| 47 | Lateral Displacement index (Zhang, Robertson and Brachman, 2004) |
| 48 | Clean sand box. Reports if a layer falls within the clean sand box reported by Robertson & Wride (1998) |
| 49 | EQ zone. Reports if a layer falls within one of the earthquake zones (A, B, or C) as reported by Robertson & Wride (1998) |
| 50 | Sand/Geologic material description. If during the layer selection process, you use the shift-right click keys, you can enter the number of the soil/geologic material description for a range of layers. This will print the soil/geologic material description on the report. |
| 51 | Sand/Geologic material number. As with the previous item, if the soil/geologic numbers were identified in the layer selection screen, this option will print the number associated with the soil/geologic description. |
| 55 | Liquefy2 Middle Depth of Layer. See Liquefy2 Users Manual |
| 56 | Liquefy2 Bottom Depth of Layer. See Liquefy2 Users Manual |
| User Defined CorrelationsThe user can define different correlations to be printed that are related to the material behavior type zones
The following are user defined correlations |
|
| 58 | In MBD Data file when distributed. This is the flag needed for Liquefy2 to recognize whether a given layer has the potential for Liquefaction |
Select Data File Parameters
If you would like a set of data printed in a data file that would be used in another program, this used this option. You select the parameters and order for each layer that you included in the data file. This is similar to the option above except that none of the header information is included in the data file. If you need other data included in the data file besides the layer data, you will need to add this information by using another Text Editor such as NotePad or Word.
Even though you have selected the parameters to be contained in the data file, if you want the data file created, you MUST also check the box. If this box is not checked, the file will not be created. You also can enter the name of the extension of the file that will contain the data. If you want other information included in the data file, you will need to go in with another Text Editor and add that information.
Select Parameters for Material Behavior Zone Plot
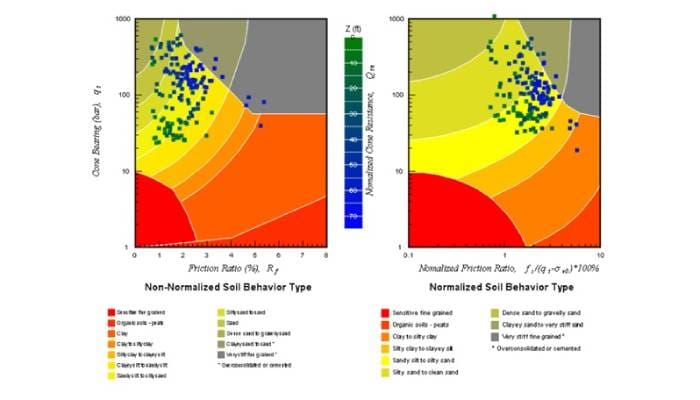
Anytime the Material Behavior Zone Plot is used, there are several overlays or data that can be selected and be shown when this is used. Some of the more common overlays are the Clean Sand Zone, the Earthquake Zones and the Normal Consolidation Zone. All of these zones can be plotted at the same time but it can become a little confusing.
The percentages can be calculated for the percent of each data point that falls within the material behavior zone. This is useful in determining how well the classification of the layer matches the various data points the comprise the layer.
View
The View menu will provide the user with the following options. See Figure 4-8.
1-Layer Number
4-Depth to Bottom of Layer / Data Pt.
6- Qc (Measured PS)
7-Qn
8-QC1N (Normalized & Overburden Corrected)
9-QC1NCS (Equivalent Clean Sand)
10-Sleeve Stress
11-Pore Pressure
12-Friction Ratio
13-Material Behavior Number
14-Material Behavior Zone Description
15-USCS Soil Description
16-Unit Weight
18-Qc to N Ratio
19-SPT based on Qc to N Ratio
20-SPT based on Ic
21-Relative Density
22-Friction Angle
23-Undrained Shear Strength
24-Over Consolidation Ratio
25-Fines Content from Ic
27-D50
28-Nk, Cone Factor
35-Ic Material Index
40-Layer Liquefaction Factor of Safety
42-Volumetric Strain (%)
43-Total Settlement (vol strain *thickness)
44-Dry Sand Settlement
45-Wet Sand Settlement
46-Maximum Cyclic Shear Strain (%)
47-Lateral Displacement Index
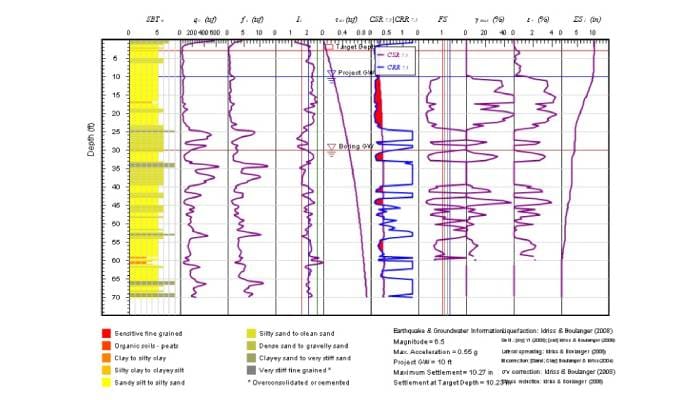
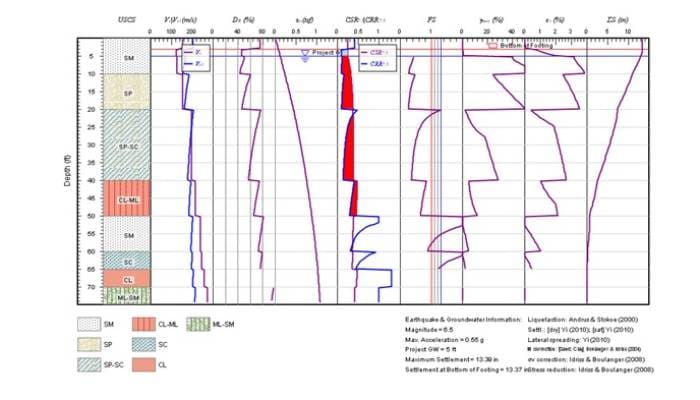
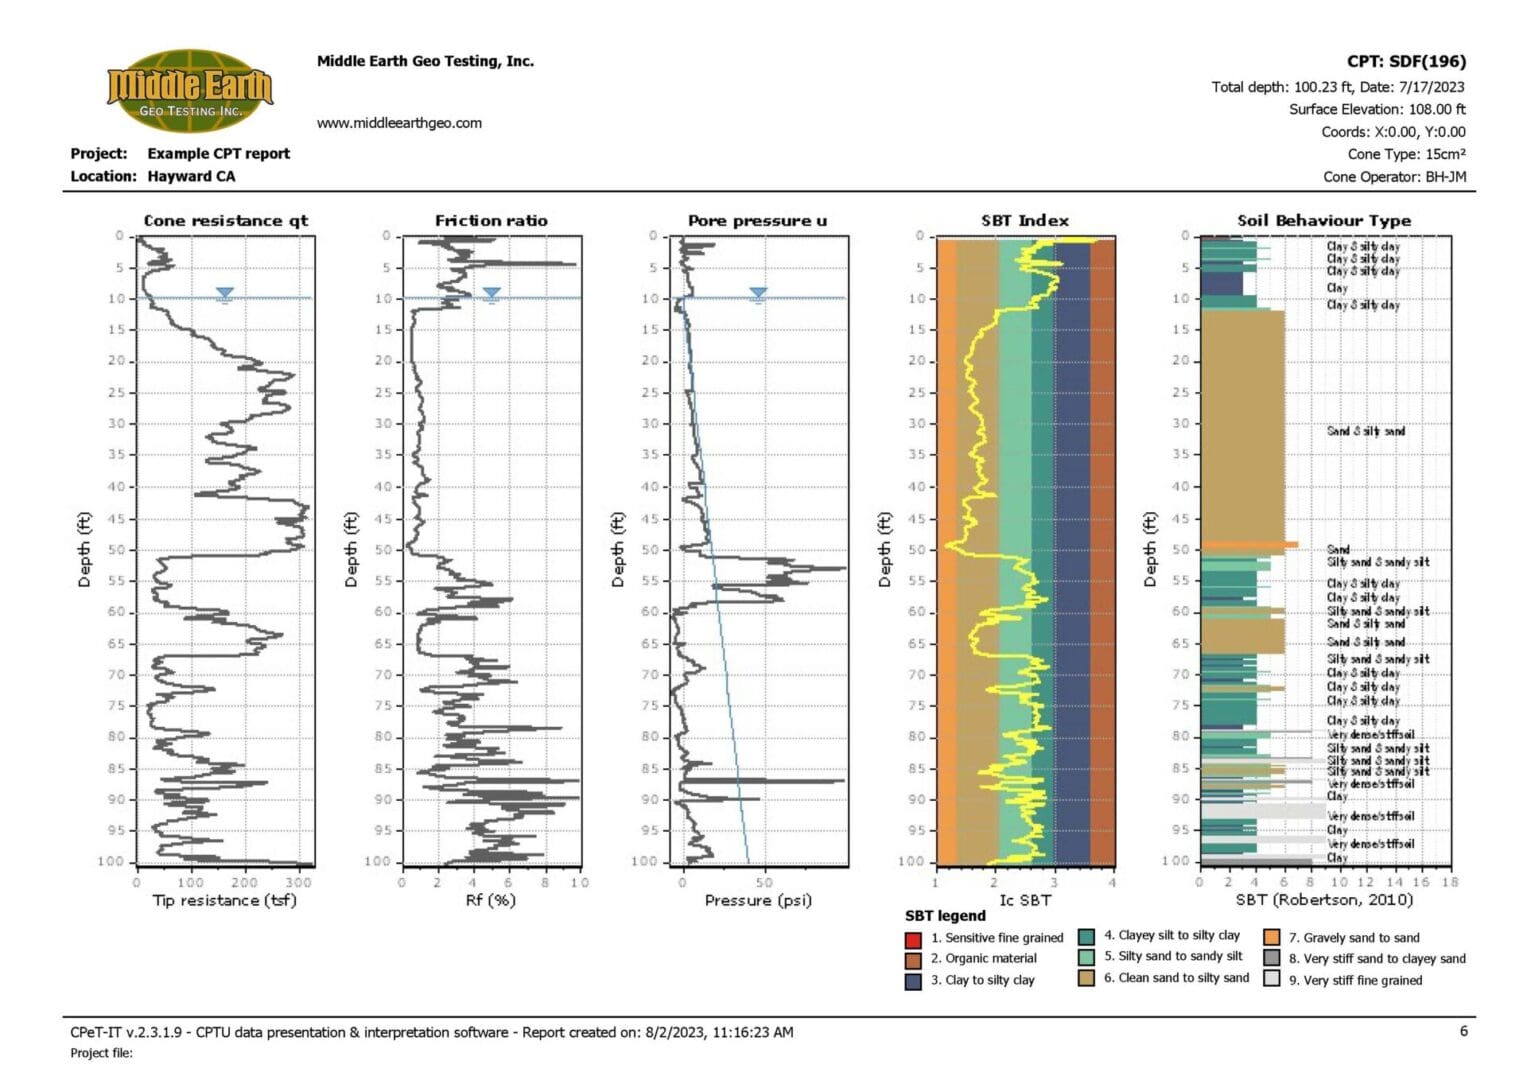
These options are also available to be printed out in a .pdf graph it is highly recommended that there are not more than 8 graphs chosen per page.
 Loading...
 Loading...
 Loading...
Report 1
 Loading...
 Loading...
 Loading...
 Loading...
Report 2
 Loading...
 Loading...
 Loading...
 Loading...
 Loading...
 Loading...
